Software and pipeline
Workflow
|
This workflow diagram (right) illustrates the data,
tools, and workflow used for the works presented on this site.
The resources (clickable URL below and within the graph) of data, tools, and scripts used to form the workflow are listed below. |
RNA quantification pipeline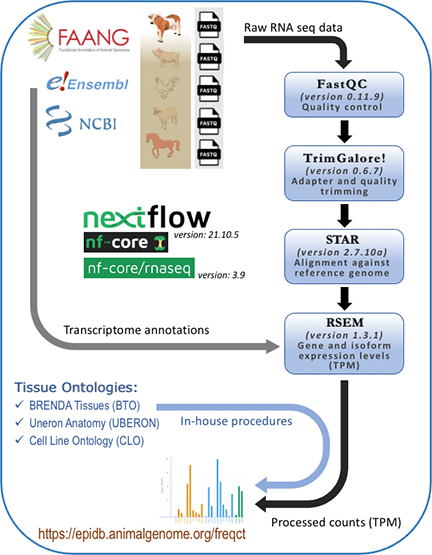
|
Data sources
Shell script to run the piepline
#!/usr/bin/bash
#SBATCH -o "stdout.%j"
#SBATCH -e "stderr.%j"
#SBATCH --mem 100GB
##SBATCH -p amd
#SBATCH -N 1
#SBATCH -n 20
#SBATCH -t 12:00:00

GENOME=.../Bos_taurus.ARS-UCD1.2.dna.toplevel.fa.gz
GTF=.../Bos_taurus.ARS-UCD1.2.107.gtf.gz

module load nextflow
export NXF_SINGULARITY_CACHEDIR=/path/NXFContainers/

nextflow run nf-core/rnaseq --input sample_sheet.csv --outdir star_rsem_output --fasta ${GENOME}  --gtf ${GTF} -resume -profile singularity --aligner star_rsem
Outcomes
The end results of processed TPM counts can be visulized as
bar graphs showing expression levels (counts) by tissues and genes with our
in-house tool.
* All data use at the EpiDB follow the FAANG data sharing statement.